![]()
Search
| Home
| Data | Bays
and Estuaries
 |
Hydrodynamic
& Oil Spill Modeling
|
 |
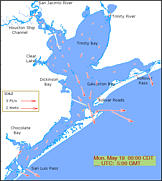
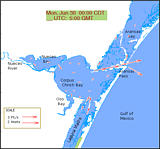
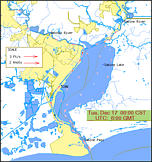
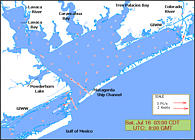
Simulations presented on this web page show the speed and direction of
water movement, i.e. currents, in Galveston, Matagorda and Corpus Christi Bays, and Sabine Lake. Currents
are shown for a moving three-day window, beginning yesterday and finishing
tomorrow, which slides forward every day. Flows are actually computed
for about four weeks prior to today and extend through about a week beyond
today, but only results for the three-day window are shown.
| Model Description | Input (Tides, Winds, Riverflow) |
Modeled Currents with Associated Tides
Models are run daily and updated at the local times indicated below.
| Galveston Bay | Corpus Christi Bay | Sabine Lake | ||
|
|
|
||
| Frame by frame (700+ kb). | Frame by frame (500+ kb). | Frame by frame (1000+ kb). |
| Matagorda Bay | San Antonio and Copano Bays | ||
|
 |
||
| Frame by frame (800+ kb). | Expected 2012. |
TxBLEND Model
Currents are computed with a model called TxBLEND. The model was developed
at Notre Dame University and was subsequently adopted, modified, and applied
by the Texas Water Development Board's Environmental Section to Texas'
bays and estuaries. TxBLEND is a two-dimensional (vertically-averaged)
finite element model which solves the continuity equation, momentum equations,
and the advection-diffusion equation for conservation of salt. The numerical
grid for Galveston Bay consists of 2113 nodes, Matagorda Bay has 2927, Corpus Christi Bay has 4218,
and Sabine Lake has 2341 nodes. The computational time step for the Matagorda
Bay model is 150 seconds, and for the other bays and Sabine Lake, it is 300 seconds.
Water velocities and depths are calculated by TxBLEND at each of these nodes
for each time step, but results are displayed only every three hours within
the three-day window described above, and only for the few nodal locations
shown.
Oil Spill Application
One application of these model calculations is that of predicting oil
movement should a spill occur in one of Texas' bays. Current directions
at a given location and time are given by the vectors (arrows) shown in
the displays. The length of each vector indicates the current speed,
according to the legend included on each frame.
Currents predicted by this model are input into another type of computer
model known as a trajectory model. This model, called SpillSim, uses currents,
winds, and other information to predict where oil will move in the near
future. Oil-spill emergency response teams coordinated by the Texas General
Land Office use information provided by these models to deploy clean-up
teams and other resources to minimize a spill's impact.
Input and Related Data:
| Galveston Wind | Corpus Christi Wind | Sabine Lake Wind | |||
| Matagorda Wind | |||||
| | |||||
| Tides for Texas | 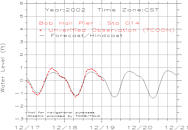 |
Tides
Tides are the slowly changing rise and fall of the ocean and bay levels
in response to interactions between the sun, moon, and earth.
Tides are normally the dominant force in generating the currents in Texas'
bays. Rising tide levels in the Gulf of Mexico push water into them through the passes.
For example, tidally driven currents enter Galveston Bay through San
Luis Pass, the pass at Bolivar Roads, and Rollover Pass.
Falling tides in the Gulf drain the bays through the passes.
Gulf tides are measured along the Texas coast by the Texas
Coastal Ocean Observation Network (TCOON) in cooperation with the
National Oceanic and Atmospheric Administration (NOAA). TWDB computes
forecasts for over 20 of these stations based on tidal harmonic
constituents from several years of measured data. Comparisons between the
measured tides and the hindcasts/forecasts are shown at the
Tides for Texas
site and indicate the effect of meteorological phenomena on the tide.
The differences in the measured data and the hindcasts are largely due
to meteorological events.
Data from the station at Pleasure Pier is used for Galveston and Matagorda Bays, the
Bob Hall Pier station for Corpus Christi Bay, and the Sabine Pass
station for Sabine Lake. The input is composed of the most recent tide
measurements, obtained daily, and the forecasted tides, which are adjusted
according to the recent tide data. The tides are applied to the model's
outermost Gulf boundary to drive TxBLEND simulations.
Wind
Wind values used in the bay models are derived from the
Eta Model
of the National Centers for Environmental Prediction (NCEP).
Staff in the
Texas A & M University Oceanography Department.
process the Eta output and provide the Texas Water Development Board with
wind data files particular to the bay or estuary. The winds are from the model; none of them are direct observations,
although observations closely agree with the values at the time they were created, since observations are interpolated to the
Eta model grid.
The wind links above
show the hindcast/forecast for the wind speed and direction
that is put into the TxBLEND model for the respective bay, including a "stick plot".
River Inflows
Rivers provide the dominant source of freshwater inflows to the estuaries. The
model input for the principal stream flows are the daily means based on the latest
recorded measurements from the
United States Geological Survey (USGS)
stream gages and are updated daily. The last daily mean available is the
day previous to when the model is executed, so that day's value is used subsequently.
For example, a model that is executed today will use daily mean flows as
measured through yesterday. Yesterday's inflow is extended to the value for today's and the following days' inflows.
Other minor sources of inflows which may be included are: constant value inflows derived from historical flows or from estimates of ungaged surface run-off averaged over a normal year;
and monthly estimates of flows from power plants based on their historical water intake and returns.
Inflows to the Galveston Bay model are based on daily mean gaged flows from the Trinity and San Jacinto rivers, the Buffalo and Chocolate Bayous, and other bayous in and around the Houston area.
Other model inputs include monthly estimates of historical water intakes and returns from power plants in the region and estimated constant-value ungaged surface runoff to the estuary.
For the Sabine Lake model, gaged inflows are available for the Neches river, its
tributaries and the Sabine River. Inflows for four other minor watersheds are assigned constant values based on estimates of their historical average.
Similarly, inflows to the Matagorda Bay model are based on daily means of gaged
flows from the Colorado, Lavaca, Guadalupe and Tres Palacios rivers, as well as from Garcitas and Placedo Creeks. Other, minor inflows are estimated and left constant.
The Corpus Christi Bay model has only two significant sources of inflows, the Nueces River and Oso Creek, both of which are gaged and so have
mean daily inflows.
For more information, please contact:
Gayla Ray - Surface Water Resources
Telephone: (512) 936-0817
For information on offshore and nearshore currents and winds, go to the:
Texas Automated Buoy System
Back to TOP